America's Most Polluted Cities 2010
Apr 28th, 2010
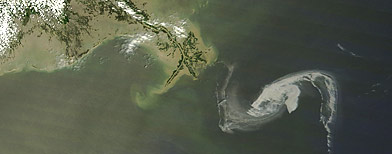
President Obama's recent proposal to open some areas along the eastern Gulf of Mexico, the Atlantic coastline and the north coast of Alaska to oil and natural gas drilling elicited praise from drilling advocates and oil companies as well as sharp criticism from environmental groups and citizens near the areas that might be affected.

The environmental impacts from doing so won't be felt for some time. What's affecting Americans today? Poor air quality. This matter often gets buried under more high-profile concerns like climate change, but it is particularly important as summer approaches because sunlight is a key ingredient in making harmful ozone, a ground level gas that contributes to urban smog and inflames the lungs, causing shortness of breath, wheezing and throat irritation.
Sunny areas like Los Angeles face the harmful effects of ozone year-round. In fact, the Los Angeles metro is named the country's worst for ozone by the American Lung Association's State of the Air 2010 report, released Wednesday. The ranking is worrisome for the city's residents because inhaling ozone is akin to "getting a sunburn on your airways," says Dr. Norman H. Edelman, the ALA's chief medical officer.
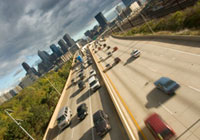
Other California metros didn't fare much better:Bakersfield, Visalia, Fresno and Sacramento round out the five worst regions for ozone. The problem is statewide because of both California's exposure to sunlight and a natural geography that allows pollution to hover rather than diffuse to other areas, says Janice Nolen, the ALA's assistant vice president for policy and advocacy.
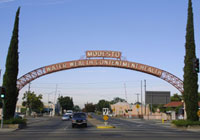
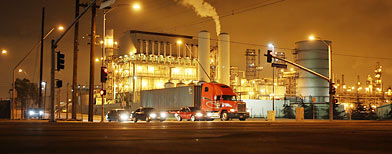
The State of the Air report also ranks cities based on short-term and year-round particle pollution, which are caused by emissions of sulfur dioxide, carbon and nitrogen oxides. The short-term measure ranks metros by periodic spikes in airborne particles, and Bakersfield, Calif.; Fresno, Calif.; Pittsburgh; Los Angeles; andBirmingham, Ala., were, by this measure, found to have the country's five worst.
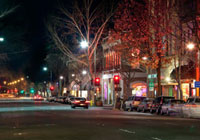
Some of these cities also show up in the rankings for year-round particle pollution, which measures the daily average level of airborne particles. The five worst areas are: Phoenix-Mesa-Scottsdale, Ariz.; Bakersfield, Calif.;Los Angeles; Visalia, Calif.; and Pittsburgh.
Behind The Numbers
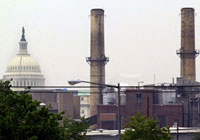
State of the Air 2010 ranks metropolitan statistical areas and combined statistical areas based on data collected by the U.S. Environmental Protection Agency (EPA) between 2006 and 2008. Both the ozone and short-term particle pollution rankings are based on spikes in their daily measurements and were calculated using weighted averages; each level of the Air Quality index was given a numerical weight, and these values were then multiplied by the number of days each metro reached them. Contrarily, the year-round particle pollution rankings are based on the average daily airborne particle levels during the three years studied.
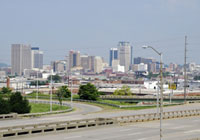
The ALA found that over 175 million Americans, or 58% of the population, live in counties with unhealthy levels of either ozone or particle pollution. Worse, almost 24 million people live in counties with unhealthy levels of ozone and both short-term and year-round particle pollution.
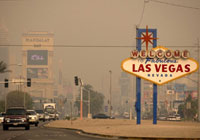
Poorer populations are especially vulnerable. "People in poverty often live near major highways, near sources of pollution," Nolen says.
What's more, bad air impacts Americans' wallets. Using data from various environmental groups as well as California's Office of Statewide Health Planning and Development, which indicates where, when, and why people were admitted to the emergency room or had a hospital visit, the RAND corporation found that from 2005 to 2007 California's dirty air resulted in more than $193 million in hospital-based medical care. Medicare and Medi-Cal, the state's Medicaid program, paid for about two-thirds of the expenses, placing the financial burden on taxpayers.
Bad But Getting Better
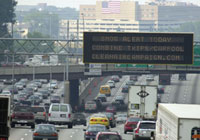
The news isn't all gloomy. Twenty of the 25 worst metros for year-round particle pollution reported lower particle levels this year than in the 2009 report. Sixteen cities including Pittsburgh and Atlanta also reported their lowest year-round particle pollutions levels since the ALA released its first State of the Air report in 2004.

These improvements should only continue given the aggressive regulations announced last decade. In 2005 the EPA introduced the Clean Air Interstate Rule, which forces companies in 28 states, predominately in the eastern half of the country where coal-fired power plants burn most often, to cut their sulfur dioxide and nitrogen oxides emissions. A year earlier it also announced the Clean Air Nonroad Diesel Rule, which places tough emissions requirements on diesel engines used in various industries including construction, agriculture and mining. In 2004 these emissions accounted for 47% of all diesel particulate pollution, according to the EPA.
The bar may be raised even higher this year. In February Sens. Tom Carper, D-Del., and Lamar Alexander, R-Tenn., proposed the Clean Air Act Amendments of 2010, legislation that would impose stricter limits on mercury emissions from coal-fired power plants and place tougher national limits on sulfur dioxide and nitrogen oxides emissions. If passed, these new rules will be the first amendments to the EPA's Clean Air Act in 20 years.
5 Worst Cities For Ozone Pollution
1. Los Angeles-Long Beach-Riverside, Calif.
Total Population: 17,786,419
Pediatric Asthma: 442,040
Adult Asthma: 1,094,827
Chronic Bronchitis: 556,68
Emphysema: 200,338
2. Bakersfield, Calif.
Total Population: 800,458
Pediatric Asthma: 22,479
Adult Asthma: 46,597
Chronic Bronchitis: 23,265
Emphysema: 7,790
3. Visalia-Porterville, Calif.
Total Population: 426,276
Pediatric Asthma: 12,749
Adult Asthma: 24,202
Chronic Bronchitis: 12,169
Emphysema: 4,249
4. Fresno-Madera, Calif.
Total Population: 1,057,486
Pediatric Asthma: 29,351
Adult Asthma: 62,100
Chronic Bronchitis: 31,280
Emphysema: 10,965
5. Sacramento--Arden-Arcade--Yuba City, Calif.-NV
Total Population: 2,417,404
Pediatric Asthma: 55,670
Adult Asthma: 153,359
Chronic Bronchitis: 78,640
Emphysema: 29,653
